关于流动性猎取
问:
I'm trying to understand what's happening when a candle is in the middle of forming and suddenly, violently a huge wick appears very far below the body, then just as suddenly jumps back up. During news events I understand that market is searching for the best fair price before settling. But what about when it is not news? I've heard "liquidity grab" but that's what I don't get. Also, could there be a limit buy order down there? But how does it "jump" so far down?
我想理解当一根蜡烛线正在形成过程中,突然间出现一个远低于实体的巨大下影线,然后又突然跳回来时,到底发生了什么。在新闻事件期间,我理解市场在寻找合适的价格水平。但是当不是新闻事件时呢?我听说过"流动性猎取"这个词,但我不太明白。另外,在那么低的位置会有限价买单吗?为什么价格会"跳"那么远?
答:
Liquidity grabs will happen at old highs and lows, DT and DB, at trendlines, etc. when you are reading bars. Pay attention to bar open and close price. If a 5 min bar starts as a bear bar and last minute it flips to being a bull bar, it is telling you something. We don't worry about liquidity grabs etc. that term is not even in the BTC courses but stop run is. Al talks about how stops are run and where you should not put your stop.
流动性猎取通常发生在历史高点和低点、双顶和双底、趋势线等位置。在阅读K线时要注意开盘价和收盘价。如果一根5分钟K线开始是空头K线,但在最后一分钟翻转成多头K线,这就在告诉你一些信息。我们不用太担心流动性猎取这个概念,这个术语在 BTC 课程中甚至都没有提到,但确实会讲到止损点被触发。Al(Brooks)讲解了止损点是如何被触发的,以及在哪里不应该设置止损点。
You can trade any bar. You need to understand the what type of bar you are trading. There are two types of bars: trend bars and trading range bars. Trend bars are the ones with strong open and close. You can but the close and above a bull bar that closes on its high, it will get continuation in a trending environment.
你可以交易任何K线。你需要理解你正在交易的是什么类型的K线。K线有两种类型:趋势K线和区间K线。趋势K线具有强劲的开盘价和收盘价。你可以在一根收盘价接近最高点的多头K线的收盘价位置或其上方买入,在趋势环境下它会继续延续。
Trading range bars are the dojis with weak closes or small bodies, long wicks, small or big pin bars etc. you should trade them like trading ranges, expect buyers under the bars, and sellers above.
区间K线包括十字星(收盘较弱或实体较小)、长影线、小型或大型针状线等。你应该把它们当作交易区间来交易,预期K线下方有买家,上方有卖家。
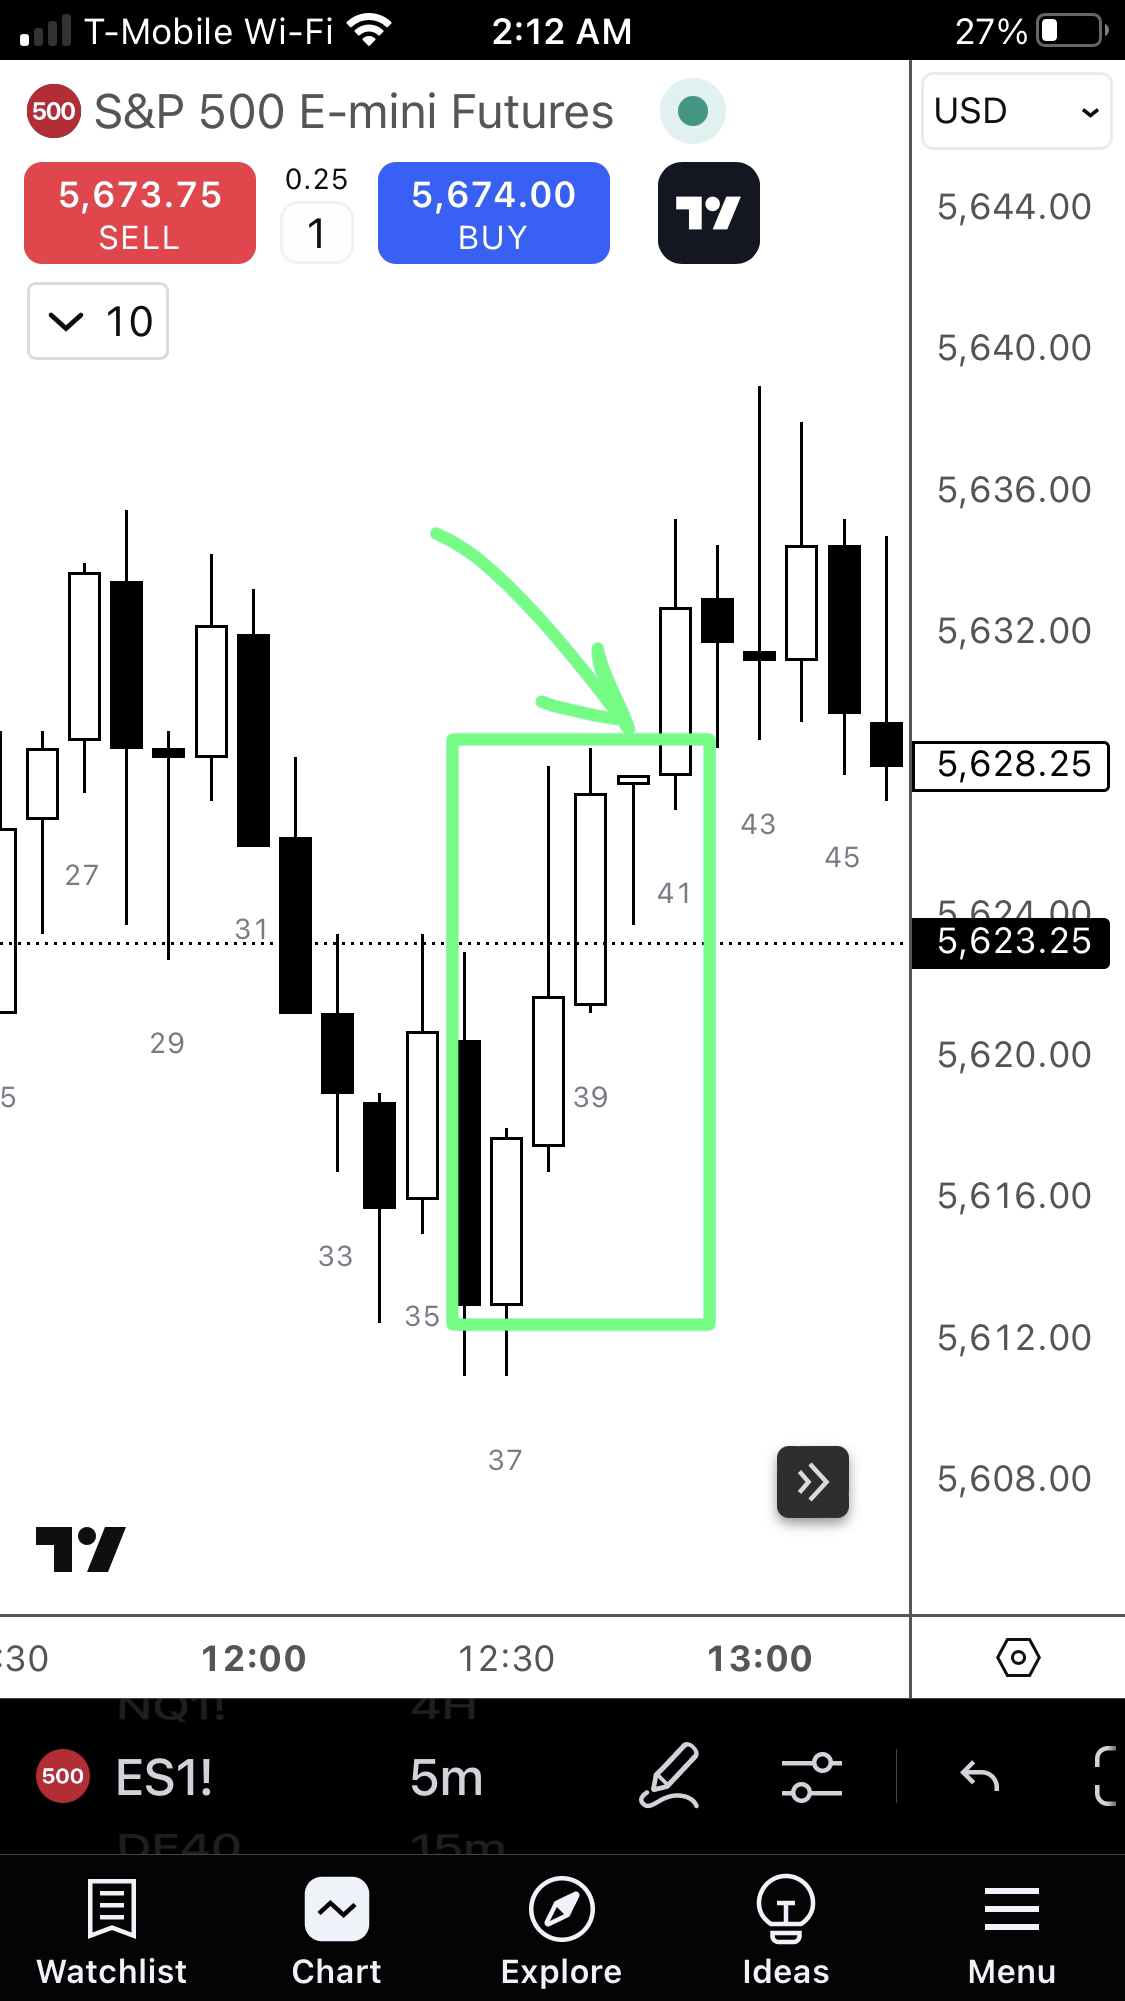
We also pay attention to the environment. A very good looking strong trend bull bar can attract sellers and trades that bet against strong bull close and sell it instead. This happens generally in trading ranges, it can be two or three bar range or larger range sign overlapping bars. Look at these bars for example:
我们还要关注市场环境。一根看起来很好的强劲多头趋势K线可能会吸引卖家,有些交易者会反向做空这种强势收盘的多头K线。这种情况通常发生在交易区间内,可能是两到三根K线的区间,或者更大范围的重叠K线区域。让我们看看这些K线的例子:
a) b1 closed on its low and a strong bar, bears will sell its close with a market order or below the bar.
a) b1在低点收盘且是一根强势K线,空头会在收盘价或K线下方以市价单卖出。
b) b2 is also a sell the close strong close bear bar, bears will continue to sell its close and 1t under. We are in stop order market until bars start to overlap
b) b2也是一根可以在收盘价卖出的强势空头K线,空头会继续在其收盘价和下方卖出。在K线开始重叠之前,我们处于止损单市场。
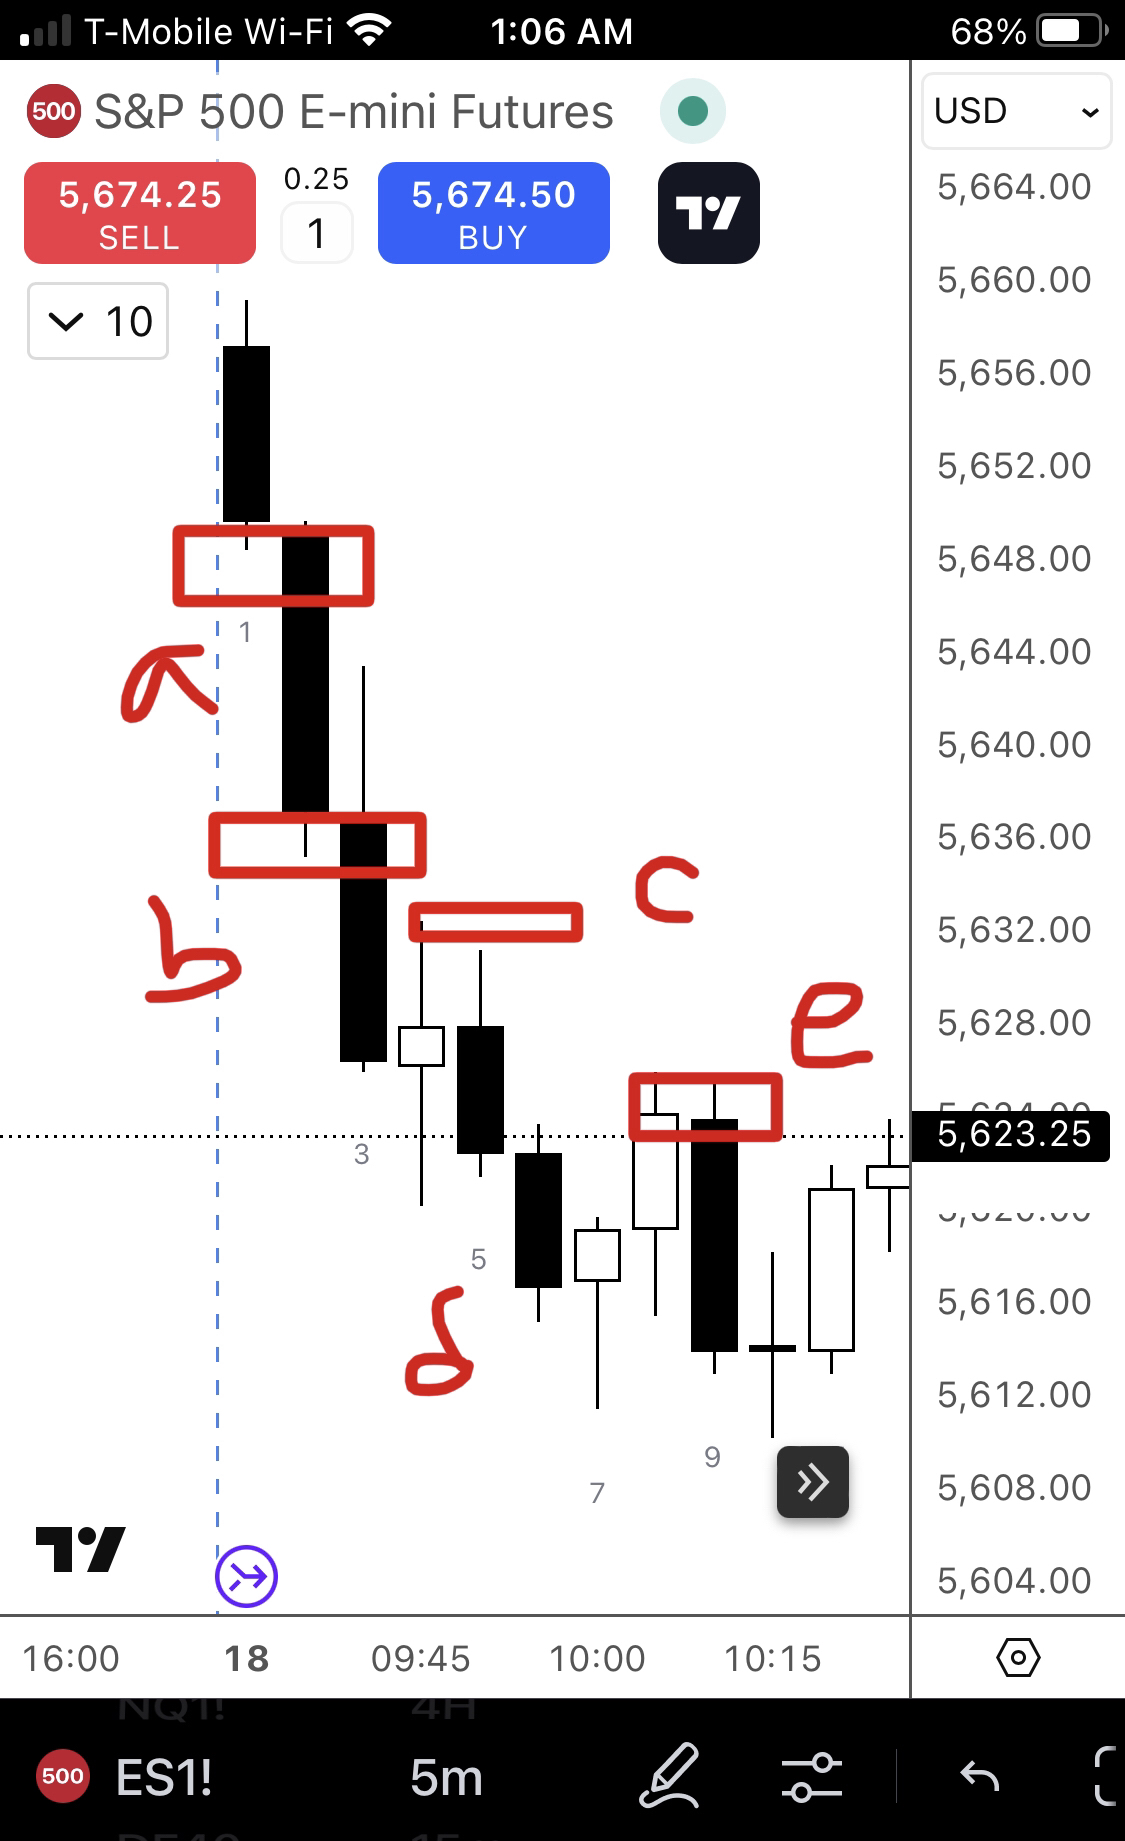
c) b3 and 4 are overlapping and b4 is what we call a trading range bar (two types of bars), it is and dojo, sellers at its high or upper 3rd and buyers could be below. Since it has been a bear trend, I would not buy below the bar but would have limit sell order orders above b4, mid point of b3 (50% of its body) waiting to be processed. I am committed to sell and not counter buy.
c) b3和b4是重叠的,b4是我们所说的区间K线(两种类型的K线之一),它是一根十字星,卖家在高点或上部三分之一位置,买家可能在下方。由于这是一个空头趋势,我不会在K线下方买入,而是会在b4上方和b3实体中点(实体的50%位置)设置限价卖单等待执行。我坚持做空而不是反向做多。
d) b6, b7, b8 are overlapping or going sideways. Market entered into trading range sideways phase here. So I need to sell above bars and buy below bars. Since it is is a bear trend, I'd rather sell. It is LOM
d) b6、b7、b8是重叠或横盘的。市场在这里进入了横盘区间阶段。所以我需要在K线上方卖出,在K线下方买入。由于这是空头趋势,我更倾向于做空。这是LOM(市场限制)情况。
e) since it is LOM conditions since b6, it is her against market, Al Brooks reached in micro or macro LOM conditions you should bet against strong bull closes and buy against strong bear closes: b8 is the strong bull close bears will buy and bulls will buy the strong bear close b9.
e) 从b6开始就是LOM条件,这是反市场的,Al Brooks指出在微观或宏观LOM条件下,你应该反向做空强势多头收盘,反向做多强势空头收盘:b8是强势多头收盘,空头会做空,而多头会在强势空头收盘的b9做多。
I hope this helps.
希望这些解释对你有帮助。
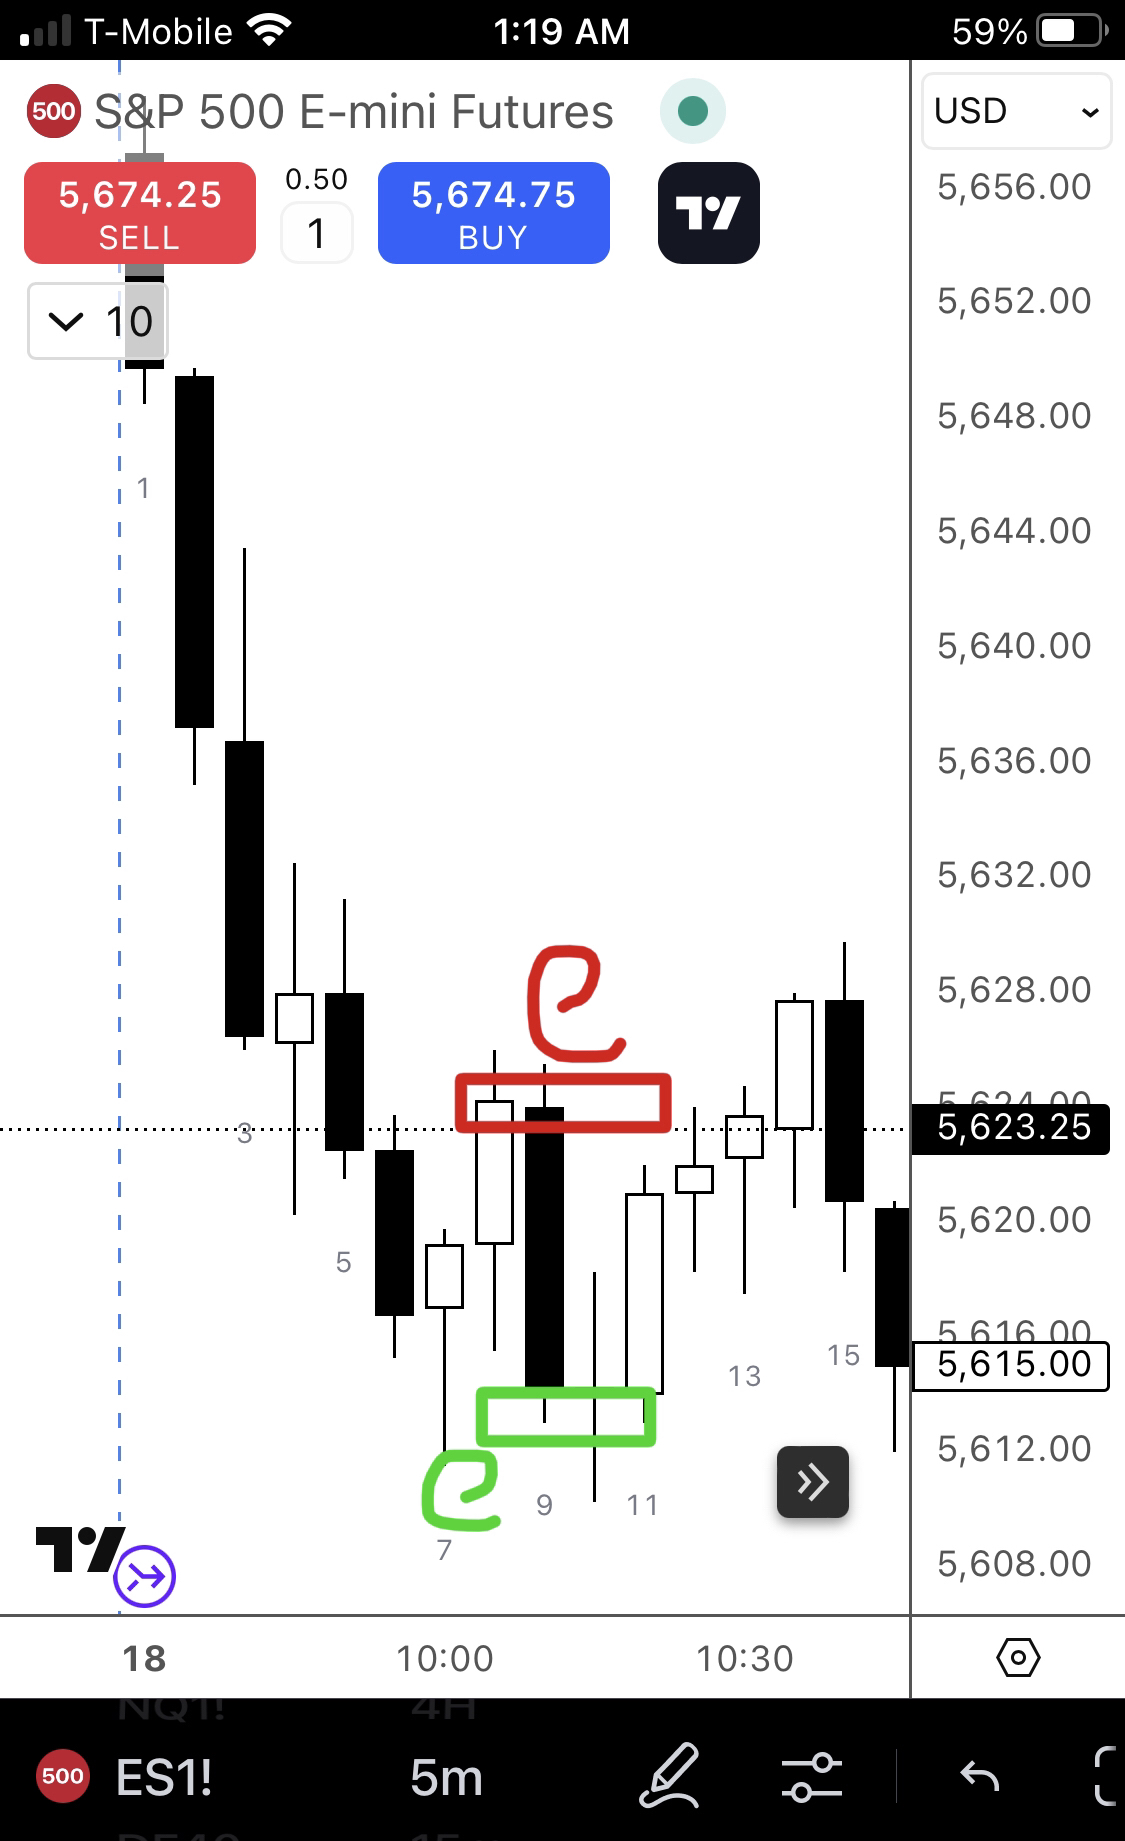
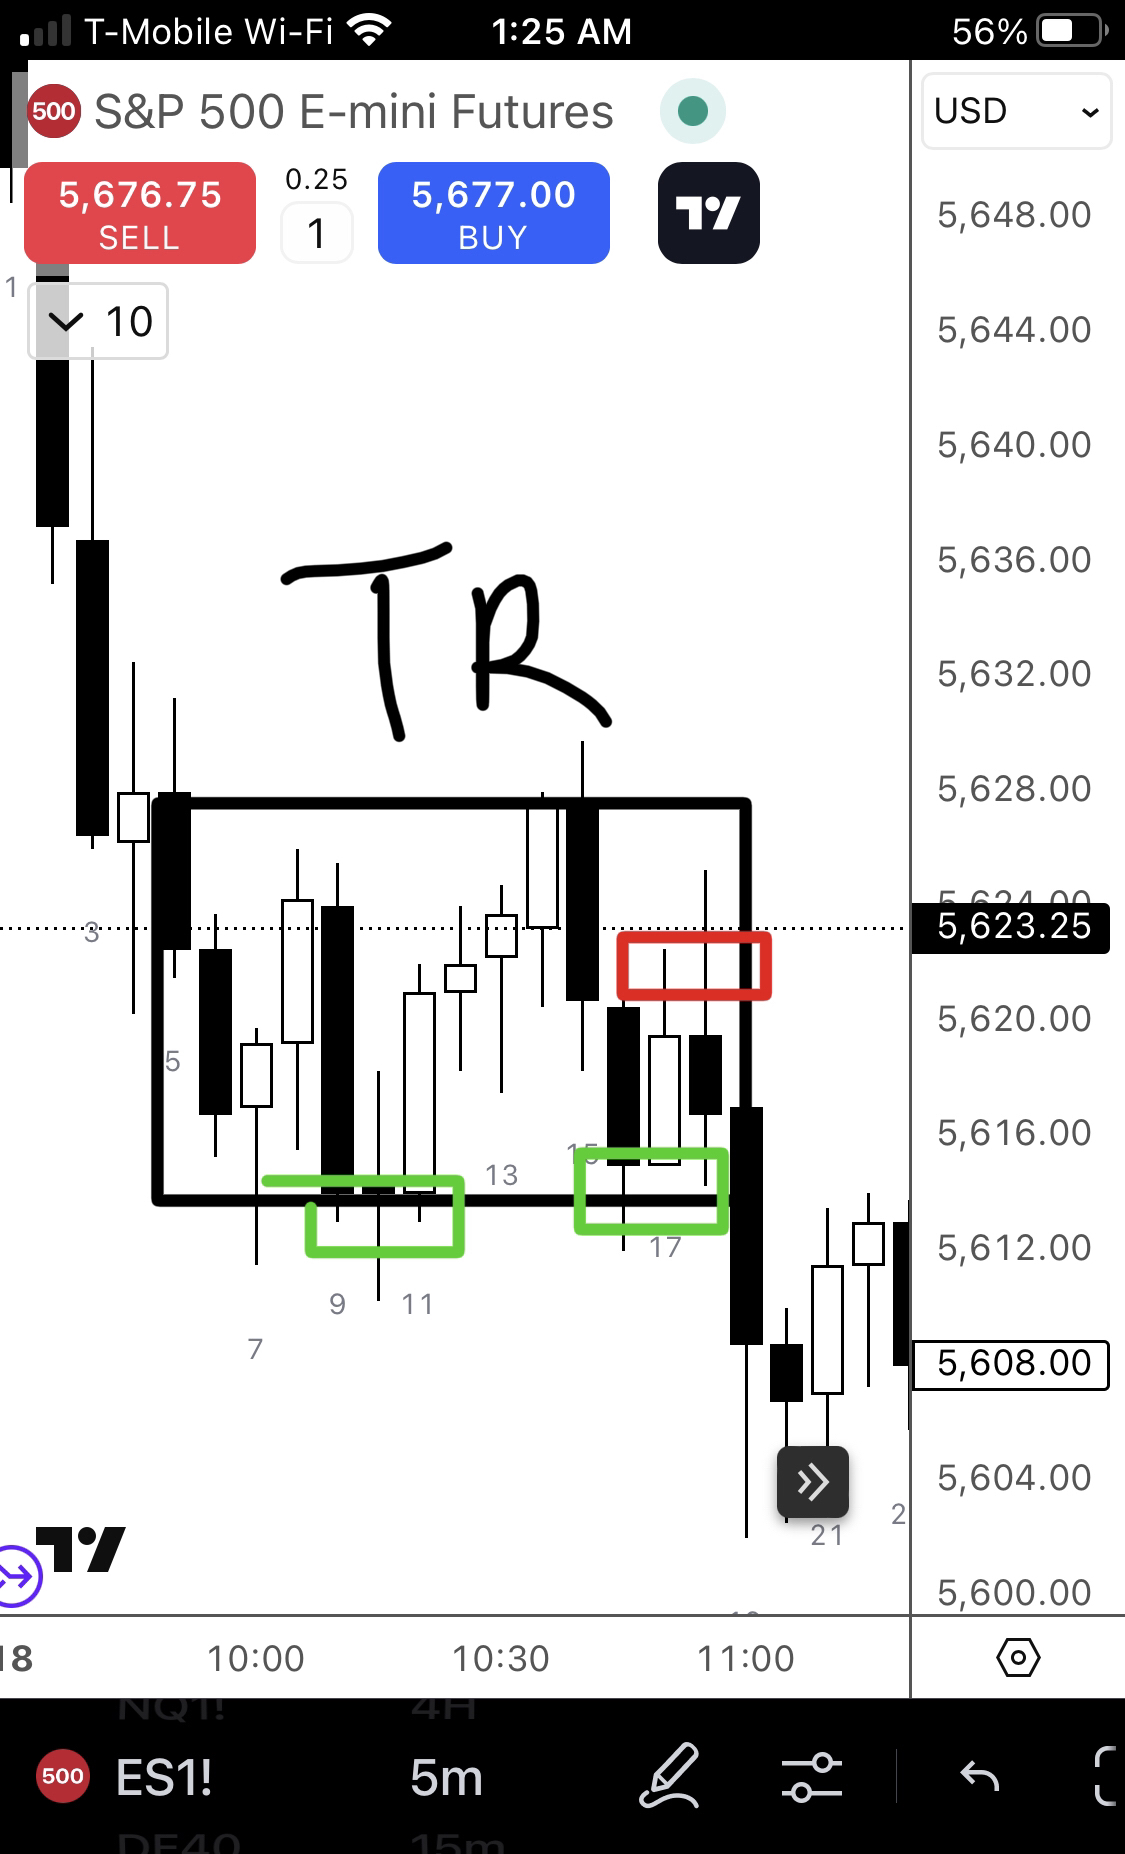
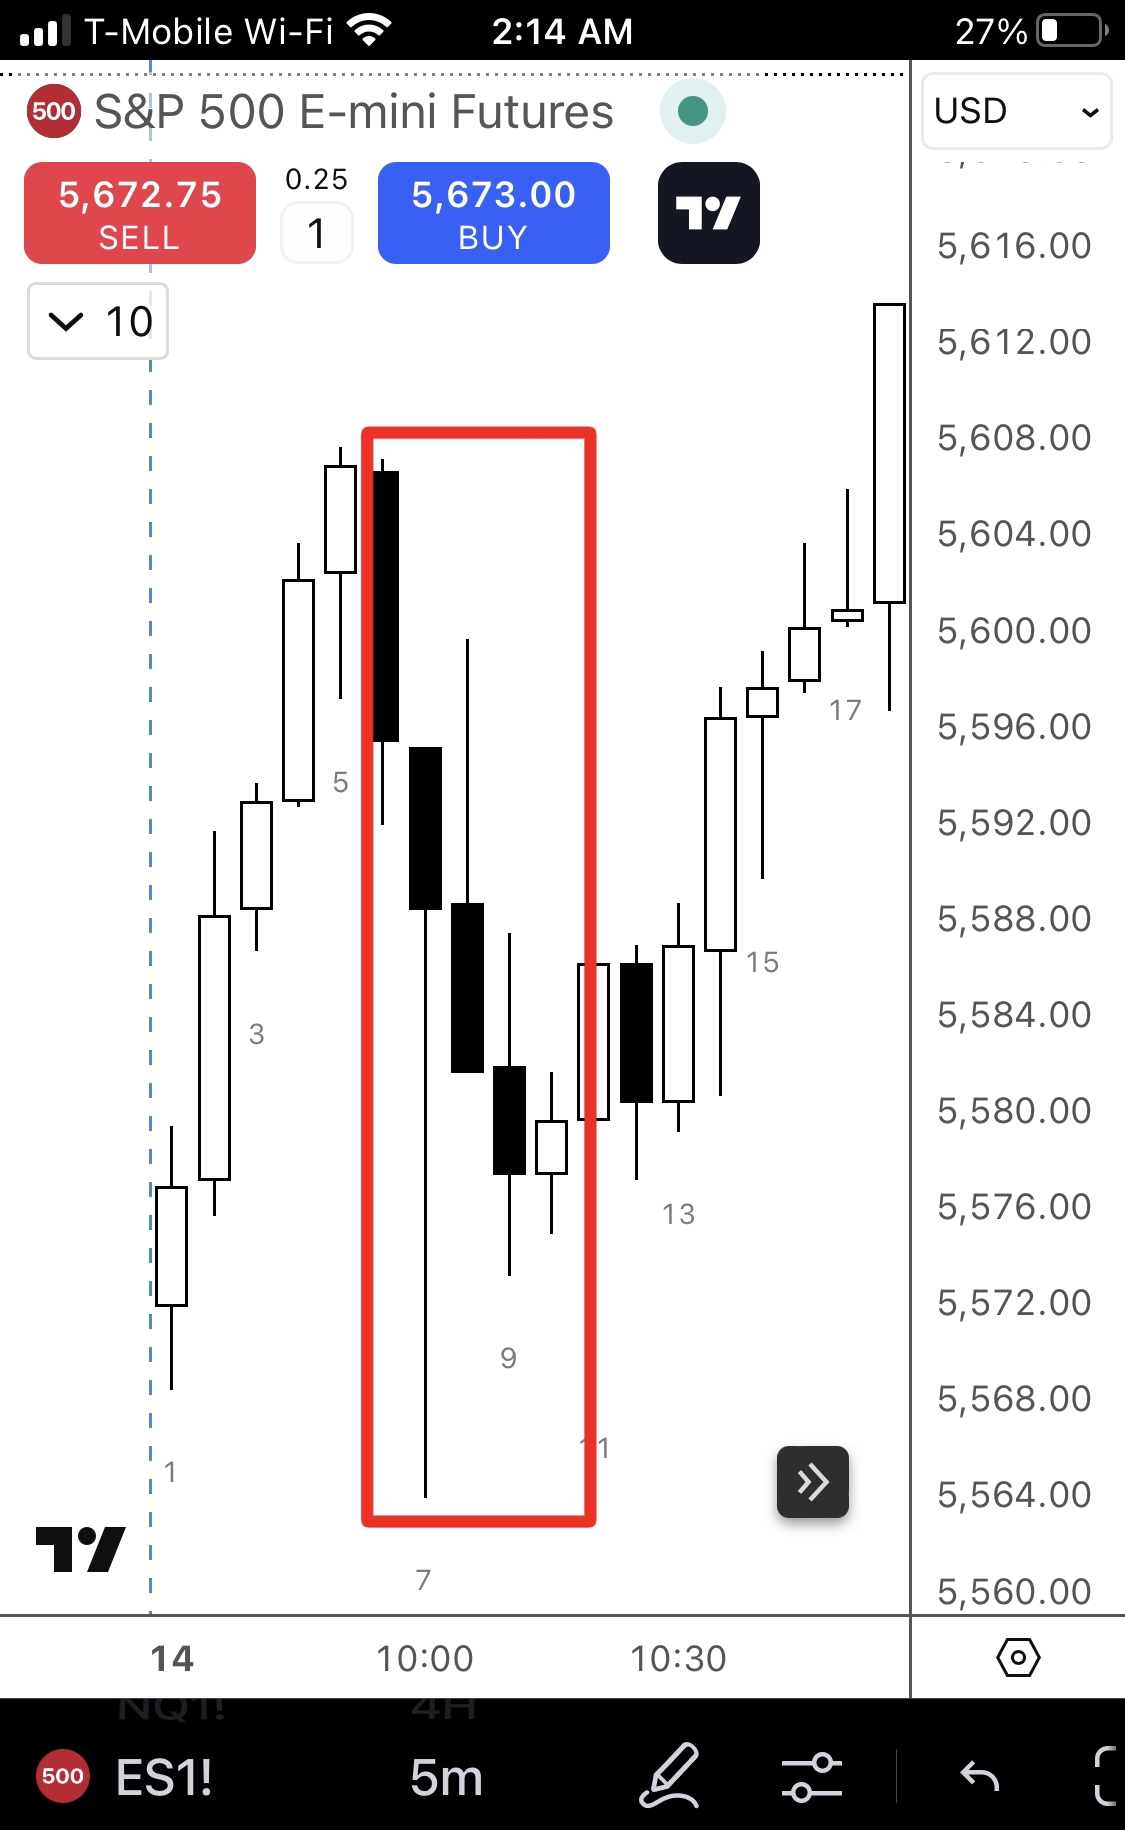
Here are more information. Black box is representing your TR and notice how it is LOM conditions and ent against market
这里有更多信息。黑框代表你的交易区间(TR),注意这是如何形成LOM条件和反市场的。
Notice how big bear bar closes are bought when bars are overlapping. Anyone selling b9 close will be trapped and force to sell the mid point of b9 to breakeven with b10. Noice how bulls bought the b9 close and b10 went up formed a wick as stuck bears sold the on to mid range to get back to where they sold which was the close of b9 and low of b9 for those stop order bears to get a breakeven. Notice how b10 body came back down to the b9 low and gave stop order bears a breakeven before closing at the close of b9. And eventually limit order bulls start to buy as the stop order bears exited with BE. Thus you get b11,12,13 14 bullish stacking up to the top of the TR.
注意当K线重叠时,大的空头K线收盘如何被买入。任何在b9收盘价卖出的人都会被套住,被迫在b9的中点位置卖出以在b10获得保本。注意多头是如何在b9收盘价买入的,而b10向上形成了影线,因为被套的空头在中间区域卖出以回到他们卖出的位置(即b9的收盘价和低点),让那些止损单空头得以保本。注意b10实体如何回落到b9的低点,在收于b9的收盘价之前给止损单空头一个保本机会。最终,当止损单空头以保本价退出时,限价单多头开始买入。因此,你看到b11、12、13、14多头K线堆积到交易区间顶部。
I think bar by bar reading is the Holly grail of priceaction trading and nothing can beat it. If you want accuracy and want to enter the market with the machines and not trade against them, you really need to understand the two types of bars Al teaches and learn how to trade them.
我认为逐根K线分析是价格行为交易的圣杯,没有什么能比得上它。如果你想要准确性,想要和机器一起进场而不是与之对抗,你真的需要理解Al教授的两种K线类型,并学会如何交易它们。
If a A doji is a trading range bar, when is it NOT good to sell its high but buy its low? Answer: when price is in a stop order market. Than the overlapping doji bar will become a follow through bar that you can buy. Bull flags are a good example or bear flags for selling a doji above but not buying below. Example; b37, 38, 39, 40 is stop order market but in a a trading range (look left). B39 is momentum as it fills b38 upper wick and you get a doji b40, will you sell above? NO. That is continuation for bulls
如果一根十字星是区间K线,什么时候不适合在高点卖出而是在低点买入? 答案:当价格处于止损单市场时。这时重叠的十字星K线将成为一根你可以买入的延续性K线。多头旗形整理就是一个很好的例子,或者空头旗形整理时在上方卖出而不是在下方买入。 例如:b37、38、39、40是止损单市场,但处于交易区间内(看左边)。b39有动能,因为它填补了b38的上影线,然后你得到一根十字星b40,你会在上方卖出吗?不会。这是多头的延续。
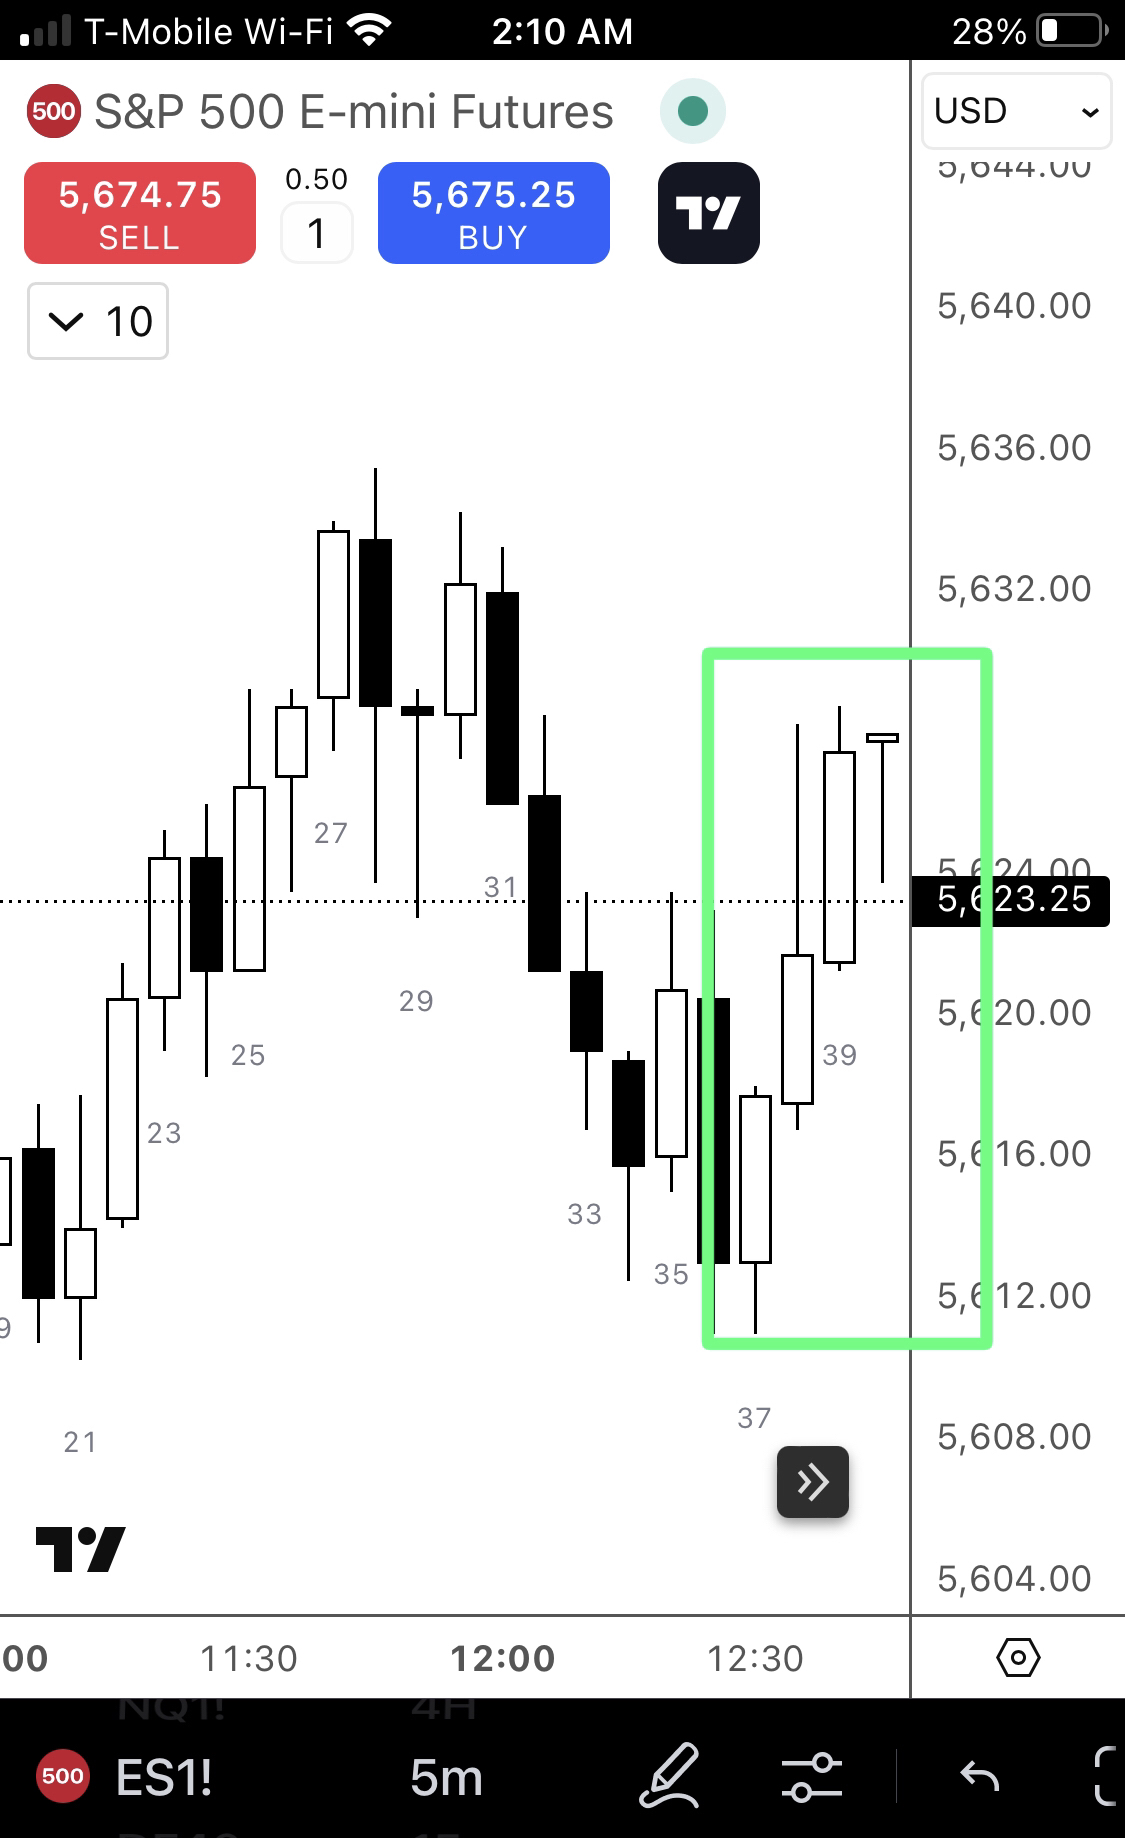
Bulls bought above doji and continued for a while. Bulls know this is a Tr and sellers above prior highs so they take profit soon So reading the conditions first and then trading the bars accordingly is key
多头在十字星上方买入并持续了一段时间。多头知道这是一个交易区间,前期高点上方有卖家,所以他们很快就获利了。 所以先读懂市场条件,然后相应地交易K线是关键。
Example: look at b6 and 7. Sell the close so it was stop order market but b7 closed weak bearish bar, so it is a doji. A bear doji, but in a trending leg. Sell above the doji rather than buy way below. You have a good shirt entry with a limit order above b7
例如:看b6和b7。在收盘价卖出所以这是止损单市场,但b7收了一根弱势空头K线,所以它是一根十字星。这是一根空头十字星,但处于趋势阶段中。应该在十字星上方卖出而不是在远低于它的位置买入。你可以在b7上方设置限价单,这是一个不错的做空入场点。
And since it is a doji and testing the TR lows, lower third to low of b7 is now a limit buy area. Bulls will be waiting to buy
由于这是一根十字星并且在测试交易区间低点,b7的下三分之一到低点现在是一个限价买入区域。多头会在这里等待买入。
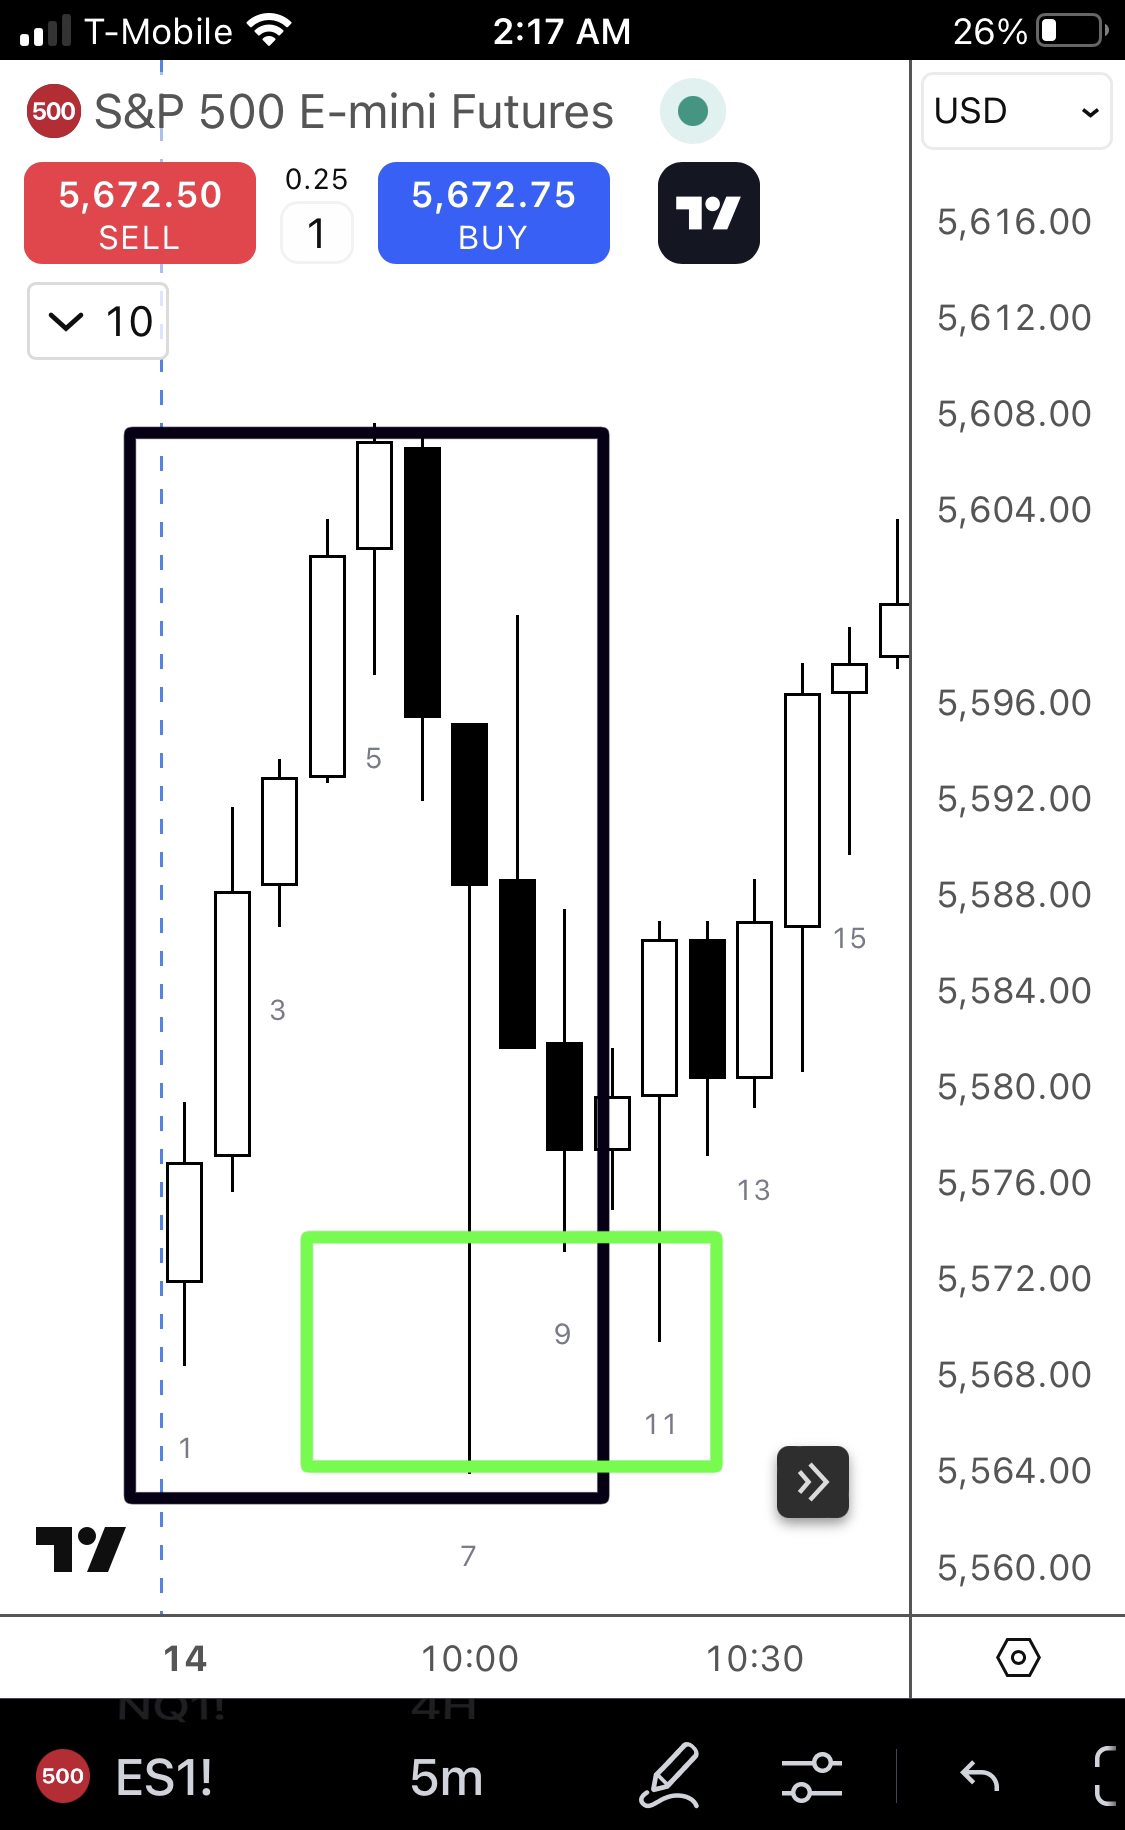
Divide the trading range bar7 into three sections and find your limit buy zone (green box), which aligns well with large TR lows (black box) and have limit orders waiting there
将交易区间的7号K线分成三个部分,找到你的限价买入区域(绿框),它与大交易区间的低点(黑框)很好地对齐,在那里设置限价单等待。